As Seen In Part One #
Recap #
As you’ve seen, we’ve hit 1Mpps in Part One. I could not figure out directly why as CPU utilization of the TRex VM was normal and the vFPC was not telling my anything weird either:
Looking at part one’s final image, one port is Receiving 1.36Gbit/s at 470K-ish PPS.
[2+2=4-quickmaths-big-shaq.jpg]
bits per packet = 1.36e9 / 470e3 = 2893 bits
bytes per packet = 2893 / 8 = 362 bytes
That is under actual forwarding conditions in an IMIX profile. This is still pretty sweet result. But is it really the max or is there a bottleneck?
iPerf vs MX150 #
To double check it was not TRex we need to test IPerf to see if it is some DPDK quirk. I’m going to replicate the TRex setup to do a transitive test of traffic through the MX.
Linux Namespacing For iPerf Test #
Just because TRex is not using host networking, it can do all this fancy stuff outside of the kernel.
To accomplish this for host networking, a separate namespace is needed for the IPerf server. The client can be in the default namespace - which is what I did.
Context: enp0s16f0np0 is wired up to xe-0/0/13. It will function the same as the TRex setup.
ip netns add ns_server
ip link set ens16f0np0 down
ip link set ens16f0np0 netns ns_server
ip netns exec ns_server ip addr add 10.0.0.1/24 dev ens16f0np0
ip netns exec ns_server ip link set ens16f0np0 up
ip netns exec ns_server ip route add default via 10.0.0.254
Configuring the client-side can be done the same, or without a namespace. It only needs a route for the iPerf namespace via the MX:
ip route add 10.0.0.0/24 via 20.0.0.254
Now the interface is bound to the namespace. This will bind the iperf3 server to the namespaced-interface:
ip netns exec ns_server iperf3 -s -B 10.0.0.1
The Setup #
Now it looks like this. It is simple forwarding. The MX has both direct routes and the ns_server namespace has the interface with 10.0.0.1 bound. When the client starts a connection to it, it will route through the MX.
        ┌────────────────────────┐
        │                        │
 ┌──────┼────────────────────────┼─────────────┐
 │  ┌───┼─────────┐  MX /    ┌───▼─────────┐   │
 │  │  xe-0/0/12  │  NFX     │  xe-0/0/13  │   │
 │  └───▲─────────┘          └───┬─────────┘   │
 │      │ 20.0.0.254             │ 10.0.0.254  │
 └──────┼────────────────────────┼─────────────┘
        │                   ┌────┼──────────────┐
 ┌──────┼───────────────────│────┼─────────────┐│
 │  ┌───┼─────────┐  iPerf  │┌───▼─────────┐   ││
 │  │      1      │         ││      0      │   ││
 │  └─────────────┘         │└─────────────┘   ││
 └──────────────────────────│──────────────────┘│
            20.0.0.1        │ Server Namespace  │
                            │                   │
                            │    10.0.0.1       │
                            └───────────────────┘
iPerf your Perf #
Pusing (-l) 128B packets to the other end with unlimited bandwidth (-b) in udp mode.
root@trex1:~# iperf3 -c 10.0.0.1 -u -b 0 -l 128
[omitted output]
- - - - - - - - - - - - - - - - - - - - - - - - -
[ ID] Interval           Transfer     Bitrate         Jitter    Lost/Total Datagrams
[  5]   0.00-10.00  sec   508 MBytes   426 Mbits/sec  0.000 ms  0/4160870 (0%)  sender
[  5]   0.00-10.00  sec   381 MBytes   319 Mbits/sec  0.001 ms  1041618/4160870 (25%)  receiver
So, it’s not TRex… 3.12M pks / 10 sec =~ 312 kpps. Where TRex probably is faster than Iperf due to DPDK. The TRex test was actually a little bit better due to DPDK.
Mind you, that this still is a VM on my Proxmox host that has a Mellanox card passed-through.
RIOT #
The NFX / MX must have some other means to get actual information about what the thing is doing. I’m directing my attention here now to see where I can reach.
Packet Forwarding Engine #
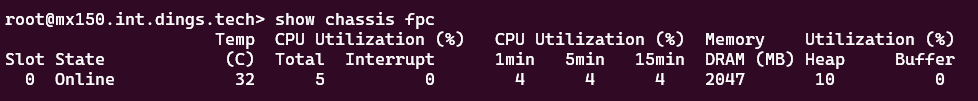
Let’s see what the PFE has to tell us during testing:
root@mx150.int.dings.tech> show pfe statistics traffic
Packet Forwarding Engine traffic statistics:
    Input  packets:           4674986653               470601 pps
    Output packets:           1362975619               470596 pps
[ omitted output ]
So I’m sending 470k packets per second and the PFE is also outputting that number. Yet, I’m not receiving those… Where do these packets end up?
Shelling the MX150 vFPC #
Because the Routing-Engine / Control-plane is not telling me anything where these packets go, I have to dig in to the riot. Which I think is a playful anagram for TRIO, the real silicon. After poking around a bit I got some information out of the thing. You just have to hit ? a few times to get further.
(PSA: Running a shell on the PFE in prod - poking at it, is not a good idea.)
root@mx150:~ # start shell
root@mx150:~ # vty fpc0
VMX- platform (1600Mhz Intel(R) Atom(TM) CPU processor, 1792MB memory, 8192KB flash)
VMX-0(mx150.int.dings.tech vty)#
VMX-0(mx150.int.dings.tech vty)# show riot port-extended-stats


----------------------------------------------------------------------
                             port_extended_stats
----------------------------------------------------------------------
Interface Extended Statistics :

[ snipped all GE ports - 12 and 13 are the 10G ports ]

Interface 12 :
Counter Name                     :    Counter Value

rx_good_packets                  :       2257653318
tx_good_packets                  :        795986511
rx_good_bytes                    :     797867490938
tx_good_bytes                    :     277095637448
rx_errors                        :                0
tx_errors                        :                0
rx_mbuf_allocation_errors        :                0
rx_q0packets                     :                0
rx_q0bytes                       :                0
rx_q0errors                      :                0
tx_q0packets                     :                0
tx_q0bytes                       :                0
rx_multicast_packets             :             5649

Interface 13 :
Counter Name                     :    Counter Value

rx_good_packets                  :       2423487707
tx_good_packets                  :        573143789
rx_good_bytes                    :     850801476779
tx_good_bytes                    :     196833039714
rx_errors                        :                0
tx_errors                        :                0
rx_mbuf_allocation_errors        :                0
rx_q0packets                     :                0
rx_q0bytes                       :                0
rx_q0errors                      :                0
tx_q0packets                     :                0
tx_q0bytes                       :                0
rx_multicast_packets             :           429850
Extending the RIOT #
At a glance, nothing special here. But port-extended-stats shows this as well:
(wide output, use horizontal scroll)
######## Absolute Statistics

IO Lcore Statistics (0    sec):
lcore_id                  pkts_in                   rx-rate                   rx_misses                 pkts_out                  tx-rate                   tx_misses
4                         2257698292                0                         11363390296418            796031485                0             0
5                         2423487707                0                         11688817876029            573143789                0             0
Total Rx: 4681185999               Tx: 1369175274
[Leonardo-DiCaprio-pointing-at-tv.jpg]
Well look at that! This is it, right? Lets poke around a bit more at the show riot commands:
VMX-0(mx150.int.dings.tech vty)# show riot ring-stats

----------------------------------------------------------------------
                             ring_stats
----------------------------------------------------------------------
 src   dst  pri used  free          enqs         drops          deqs
 io0   wk0   Hi    0  2047         28471             0         28471
 io0   wk0  Med    0  2047             0             0             0
 io0   wk0  Nor    0  2047     563939705     540781888     563939705
 io0   wk1   Hi    0  2047         31841             0         31841
 io0   wk1  Med    0  2047             0             0             0
 io0   wk1  Nor    0  2047     690692078     462224315     690692078
 io1   wk0   Hi    0  2047         77524             0         77524
 io1   wk0  Med    0  2047             0             0             0
 io1   wk0  Nor    0  2047     660735738     540798300     660735738
 io1   wk1   Hi    0  2047        410887             0        410887
 io1   wk1  Med    0  2047             0             0             0
 io1   wk1  Nor    0  2047     759268034     462197224     759268034
 wk0  tx00   Hi    0  2047         22482             0         22482
 wk0  tx10   Hi    0  2047         22488             0         22488
Looks like a ringbuffer issue. Looking at the CPU allocations made in /var/platforms-supported/rc.platform-config the ports (io0, io1) are mapped to CPU 4 and 5 - which is what we see here.
IPerf vs NFX Firmware #
Because I cannot be bothered at the moment to re-assign the cores - I chose to test my other NFX (with NFX firmware) and hooked it up the same way. Just to single out the way the different platforms behave. Because the MX150 has specific config for CPU assignments, where the NFX250 config has the virtualization options config stanza.
Config #
The config is quite different. As I’ve stated in part one, the config goes on to ge-1/0/0. Super weird and very counter intuitive. So here it goes:
set interfaces sxe-0/0/0 unit 0 family ethernet-switching vlan members 400
set interfaces xe-0/0/13 unit 0 family ethernet-switching vlan members 400

set interfaces ge-1/0/0 unit 400 description xe-0/0/13
set interfaces ge-1/0/0 unit 400 vlan-id 400
set interfaces ge-1/0/0 unit 400 family inet address 192.168.40.1/24
set interfaces ge-1/0/0 unit 400 family inet address 10.0.0.254/24
set vlans v400 vlan-id 400

set interfaces sxe-0/0/0 unit 0 family ethernet-switching vlan members 200
set interfaces xe-0/0/12 unit 0 family ethernet-switching vlan members 200
set interfaces ge-1/0/0 unit 200 description xe-0/0/12
set interfaces ge-1/0/0 unit 200 vlan-id 200
set interfaces ge-1/0/0 unit 200 family inet address 20.0.0.254/24
set vlans v200 vlan-id 200

set security zones security-zone 200 interfaces ge-1/0/0.200
set security zones security-zone 400 interfaces ge-1/0/0.400
set security forwarding-options family mpls mode packet-based
set security policies from-zone 200 to-zone 400 policy any match source-address any
set security policies from-zone 200 to-zone 400 policy any match destination-address any
set security policies from-zone 200 to-zone 400 policy any match application any
set security policies from-zone 200 to-zone 400 policy any then permit
set security policies from-zone 400 to-zone 200 policy any match source-address any
set security policies from-zone 400 to-zone 200 policy any match destination-address any
set security policies from-zone 400 to-zone 200 policy any match application any
set security policies from-zone 400 to-zone 200 policy any then permit
aaaand the answer is:
root@trex1:~# iperf3 -c 10.0.0.1 -u -b 0 -l 128
Connecting to host 10.0.0.1, port 5201
[  5] local 20.0.0.1 port 60083 connected to 10.0.0.1 port 5201
[ ID] Interval           Transfer     Bitrate         Total Datagrams
[  5]   0.00-1.00   sec  55.8 MBytes   468 Mbits/sec  457205
[  5]   1.00-2.00   sec  56.9 MBytes   478 Mbits/sec  466445
[  5]   2.00-3.00   sec  55.2 MBytes   463 Mbits/sec  452166
[  5]   3.00-4.00   sec  49.9 MBytes   419 Mbits/sec  409037
[  5]   4.00-5.00   sec  50.5 MBytes   423 Mbits/sec  413406
[  5]   5.00-6.00   sec  52.6 MBytes   441 Mbits/sec  430814
[  5]   6.00-7.00   sec  53.7 MBytes   451 Mbits/sec  440035
[  5]   7.00-8.00   sec  53.4 MBytes   448 Mbits/sec  437751
[  5]   8.00-9.00   sec  48.3 MBytes   405 Mbits/sec  395577
[  5]   9.00-10.00  sec  52.8 MBytes   443 Mbits/sec  432584
- - - - - - - - - - - - - - - - - - - - - - - - -
[ ID] Interval           Transfer     Bitrate         Jitter    Lost/Total Datagrams
[  5]   0.00-10.00  sec   529 MBytes   444 Mbits/sec  0.000 ms  0/4335020 (0%)  sender
[  5]   0.00-10.00  sec   395 MBytes   331 Mbits/sec  0.001 ms  1098862/4335020 (25%)  receiver
Not a whole lot better or worse. These results were quite consistent too.
Ethernet Flow Control #
According to Juniper there was a bug:
TL;DR: There is a problem report (PR) that it was sending flow control frames out even if it was disabled. It was patched and not applicable for my setup. But there were performance metrics in a table with packets sizes!
It states that is was tested with IXIA, proper test equipment too: At 5 Gbit/s with 64B frame length - solid.
Concluding #
From this I’m concluding that the Juniper TRIO implementation in vMX is probably very complicated - as it is in hardware. There is so little information about it as well. You have to make guesses.
Sure, you could play with the CPU allocations. DPDK allocates a dedicated CPU 100% polling the NIC for new packets - at a constant 100%. Having more CPU’s means you can allocate more to polling and thus improving throughput. Also clock speed could help a lot. Many high-PPS solutions either run custom silicon or high Ghz CPU’s for a reason.
- CPU bottleneck
- clock speed could help a lot - ATT-NFX250-LS1 runs a low end Xeon that basically is an Atom CPU.
- extra CPU’s assigned to poll-driver could help as well
riotinner workings are vague- Does it run all pipelines for a packet?
- Would applying a CoS schedulers or firewall filters affect performance?
- Does it run all pipelines for a packet?
I’m getting about 5 Gbit/s system performance (aggregating TX and RX for both ports) with a quick TRex Test on IMIX, with a box that is half the spec of an MX150. Given the price they go for on eBay, nice hobby stuff. If you need ‘real’ Juniper gear for labs or toying around.
Maybe material for Part 3, :-)